New features in Minitab 17
Within the next lines those features that are important for 6 sigma projects and should be included in BB training material are explainedFeatures to be included
1.Tool for parameter estimation2.Poisson hypothesis testing
1. Parameter estimation
Examples of possible applications:
-Process capability
-In most cases, current approach for process capability is deterministic. We estimate a value of dpu, p, mean, standard deviation, etc., and consider that it is the population parameter.
-The right approach should consider sampling, that means, confidence interval due to sampling to estimate parameters that drives to capability estimation. Then the capability would appear as an estimation as well with a confidence interval.
-MSA
-When we have a machine to substitute people at measuring attribute characteristics (example: artificial vision devices).
-IN GENERAL: whenever we need to estimate a parameter
•Path in Minitab 17
•Available for all the main statistical distributions
Process Capability
1.Let’s imagine we are measuring process capability using binomial. Our parameter is p.
2.We have followed practical rules to estimate our parameter that will be used as a baseline:
1.Long term estimation for p: n≈1000
2.Sample shows 10 out of 1000 of NOK parts. So p=0,01 -> DPMO=10000 -> Zlt = 2,33 -> Ppk= 0,78
3.Let’s work out actual estimation using new Minitab 17 features:
Process Capability
Therefore capability could be (with a 95% of confidence level) between 0,0183 and 0,0048.
-Let’s imagine our target, based on costumer/business requirement is FTT≥98,5%-> p<0,015
-Following current guidelines (deterministic method) we could thought that process already meets capability target, since initial estimation was p=0,01 with n=1000.
-But to tell the truth there is a real risk of not being meeting the target with this sample size.
-The approach should be to determine a suitable sample size (n) in a second interaction using the new feature of Minitab 17
Process Capability
-In a second step or interaction, if we want to be sure that we are meeting the target a sample size of n=3322 when an initial parameter estimation is p=0,01 will ensure us that population p is under 0,014 (0,01 + 0,004) and therefore meets the target.
-For sure, a third step when the 3322 are taken out from the process is needed to a more accurate parameter estimation. In this 3rd interaction we have to ensure again that upper value of the confidence interval is meeting the target. For instance:
-Third estimation: P’=0,009, with n=3322, then:
-Now, we are 95% sure that we meet the target since p=(0,0128 , 0,0061) THE SAME WILL APPLY TO ANY DISTRIBUTION MESSAGE: Process Capability is also an estimation (sampling). Therefore we need to find out a suitable n for our process vs target comparison
MSA
1.Let’s imagine we have an Artificial Vision Device to measure surface defects in our product.
2.These kind of machines are intended to be calibrated against an expert inspector that is our master.
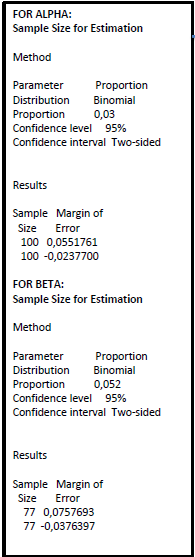
3.In order to assess Type-I & Type-II errors, we run an experiment which consists of measuring 177 units/defects with the machine in comparison to an expert. Then we assess α and β.
4.α = Assess NOK when it is OK = p(NOK/OK)
5.β = Assess OK when it is NOK = p(OK/NOK)
6.From the experiment MSA will result in:
7.- 3 were assessed NOK when they actually were OK. 3 errors out of 100 units OK. This is an estimation of alpha of 3%, p=0,03.
8.- 4 were assessed OK when they actually were NOK. 4 errors out of 77 units NOK. This is an estimation of beta of 5,2%, p=0,052.
9.It seems to be OK for most characteristics. Normally alpha ≤ 5% and beta ≤ 10% are the most common criteria of acceptance.
10.Let’s see what happens when sample size and confidence interval is taken into account. See next slide
MSA
-Estimation for alpha is:
-CI of 95% : (0,085 , 0,006)
-Estimation for beta is:
-CI of 95%: (0,128 , 0,014) Alpha = 8,5% & Beta = 12,8% will not be acceptable at all.
-Let’s find out which will be the correct sample size for this calibration/MSA:
We will need at least 461 OK units and 154 NOK units, 615 units in total to be sure we have acceptable alpha and beta risks
2. Hypothesis testing for Poisson.
Examples of possible applications:
-HYPOTHESIS TESTING in Processes to be improved when the natural metric is D/1000 and/or DPU (Poisson) instead of p, FTT and/or R/1000 (binomial).
•Path in Minitab 17
•It is available for 1-Sample and 2-Sample tests. Power & sample size will be also needed to perform H. Test:
Hypothesis testing for Poisson
1.Reasons why Poisson has to be included in Hypothesis testing Road Map:
1.FTT has being replaced by D/1000 as internal indicator for Manufacturing Processes. D/1000 metric is more sensitive to process improvements than FTT.
2.There are processes where FTT / p for defective simply does not work properly. Processes with high rate of DPU (>>1).
1.Example: In a process improvement from DPU=3 to 2. That is a big difference in terms of level of defects (issues), we are having 33% less issues, repair time, etc., in comparison to the project start. A Big improvement!!!
2.FTT will change from approx. 5% to approx. 13,5%. Less than 9% improvement! Is it true?
3.Don’t you think cost impact and therefore level of issues avoided are more related to 33% than 9%?


No comments:
Post a Comment